![[Digital logo]](../../IMAGES/DIGITAL-LOGO.GIF)
![[HR]](../../IMAGES/REDBAR.GIF)
![[Digital logo]](../../IMAGES/DIGITAL-LOGO.GIF)
![[HR]](../../IMAGES/REDBAR.GIF)
11.3.2 Altering Type Determination
As you examine the Memory Map, you may find that some segment type
names are not meaningful to you. By adding these names to the
Do-not-use Type List, you direct the Heap Analyzer to rename segments
and, if necessary, regenerate the Memory Map display.
By default, the analyzer assigns segment type names at the creation of a segment. In some cases, the analyzer assigns an element name (for example, LIBRTL). In most cases, however, the analyzer searches down the call stack to find a routine name that then serves as a segment type name.
The analyzer chooses the first routine name on the call stack that is not prohibited by the Do-not-use Type List. If the first routine is prohibited, the analyzer examines the next routine down, and so on.
This default behavior can cause the following Memory Map problems:
To add a segment type name to the Do-not-use Type List, you can select the Add to Do-not-use Type List pull-down menu item in the Options menu, or you can choose the Do Not Use Type pop-up menu item in the Memory Map, Type Histogram, or Views-and-Types Display. To delete a segment type from this list, choose the Use Type pop-up menu item in the Do-not-use Type List.
To save the contents of a Do-not-use Type List, you can choose the Save Do-not-use Type List menu item in the Options menu. This saves the list for future Heap Analyzer sessions. The Restore Do-not-use Type List menu item removes recent additions to the list since the last time the list was saved.
Figure 11-9 shows a LIBRTL\*\* entry in the Add to Do-not-use Type List dialog box you can choose from the Options menu. The figure then lists all the mouse and menu item choices available for the Do-not-Use Type List.
Figure 11-9 Heap Analyzer Do-Not-Use Type List
| 1. Do-not-use Type List Pop-Up | Use Type: Deletes a segment type from the Do-not-use Type List. |
| 2. Options Menu |
Add to Do-not-use Type List: Adds a segment type to the Do-not-use Type
List.
Save Do-not-use Type List: Allows you to save the segment types listed in your Do-not-use Type List between Heap Analyzer sessions. Restore Do-not-use Type List: Deletes additions to the Do-not-use Type List since the list was last saved. |
|
3. Memory Map Pop-Up
Histogram Pop-Up Views-and-Types Display Pop-Up |
Do Not Use Type: Adds a segment type to the Do-not-use Type List. |
11.3.3 Altering the Views-and-Types Display
As you examine the Memory Map, you may find that you need to adjust the
type display to focus more clearly on your area of interest. The
Views-and-Types Display allows you to specify changes to multiple or
individual segments of the same type.
The Views-and-Types Display is actually two windows separated by a
window sash. You can expand the left window to show all the known types
in your application. The right window contains the display options
(color, show status, expand status, and save status).
11.3.3.1 Selecting the Scope of Your Change
The Heap Analyzer receives information about segments from four OpenVMS memory managers that perform allocations and deallocations in memory space. Each memory manager has a slightly different view, or overall picture, of dynamic memory.
Each memory manager recognizes a different set of segment types. This means that, within the Heap Analyzer, where views from the memory managers are layered on each other, a single memory location can be associated with one or more segment types.
The left window of the Views-and-Types Display contains a hierarchy that reflects this integration:
To see the individual segment types recognized by each memory manager, expand the default display by double clicking MB1 on Blocks, Images, Regions, or Zones keywords. To collapse an individual listing, click MB3 on the keyword you previously selected.
This hierarchy offers you the following choices in scope:
Figure 11-10 shows the Block hierarchy item that is highlighted when you click MB1 to choose all blocks. The figure then lists all the mouse and menu item choices available in the hierarchy side of the Views-and-Types Display.
Figure 11-10 Heap Analyzer Views-and-Types Hierarchy

| 1. Double click MB1 | Allows you to expand (or collapse) the Views-and-Types hierarchy. |
| 2. Views Hierarchy Pop-Up |
Display Type: Displays a type definition in the Information window.
Go to Type: Highlights the type you have selected in the Views-and-Types Display. Do Not Use Type: Adds a segment type to the Do-not-use Type List. |
11.3.3.2 Choosing a Display Option
The right window of the Views-and-Types Display shows the display
options available, as follows:
To cancel a choice, click the Reset button, or choose the Reset menu item from the Show, Expand, or Save pop-up menus.
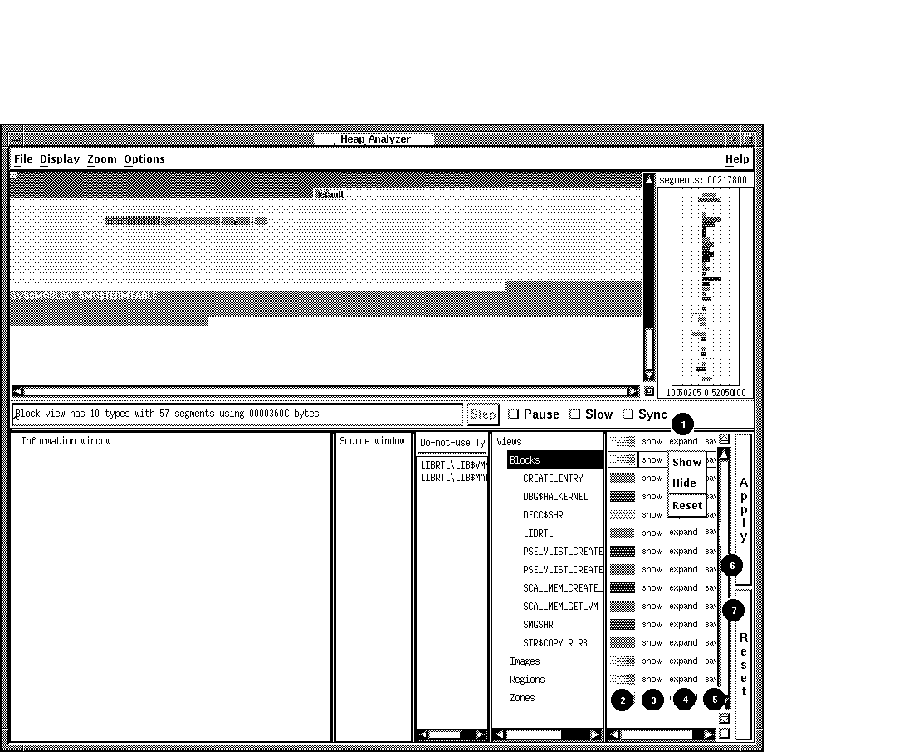
Figure 11-11 shows the Show pop-up menu that appears when you click MB3 on the options side of the Views-and-Types Display (the scope of your change, Blocks, has been previously highlighted). The figure then lists the mouse and menu item choices available in the options side of the Views-and-Types Display.
Figure 11-11 Heap Analyzer Views-and-Types Display Options

| 1. Click MB1 | Toggles the Show, Expand, and Save toggle buttons. |
| 2. Color Pop-Up | Controls the color display for individual types or groups of types. |
| 3. Show Pop-Up | Controls the display of segment types you have chosen. Show and Hide menu items allow you to restore or suppress display; Reset cancels your choice. |
| 4. Expand Pop-Up | Controls the display of segments within segment types you have chosen. Expand and Collapse menu items allow you to restore or suppress display; Reset cancels your choice. |
| 5. Save Pop-Up | Controls the Heap Analyzer's ability to show and store information on the segment types you have selected. The Remove menu item destroys all information; Save restores the ability to show and store information; and Reset cancels your choice. |
| 6. Apply Button | Applies your selections to the Memory Map display. |
| 7. Reset Button | Cancels your selections. |
11.4 Exiting the Heap Analyzer
To exit the Heap Analyzer, choose Exit from the File menu on the Heap
Analyzer screen.
11.5 Sample Session
This section contains an example that shows how to combine information from Heap Analyzer windows and menus to locate a particular memory leak in your application.
The example assumes that you have invoked the Heap Analyzer and run
your application. As you scroll back through the Memory Map display,
you focus your attention on segments that appear when your application
calls for an interactive command.
11.5.1 Isolating Display of Interactive Command
You suspect that the leak occurs when you enter an interactive SHOW UNITS command, so your first step is to clear the Memory Map and reenter the command.
To clear the Memory Map and reenter the command:
The memory space allocated to each SCA__MEM_GET_VM segment is slightly larger with each SHOW UNITS command (see Figure 11-12). This growth in what should be a same-size allocation indicates a memory leak.
Figure 11-12 Incrementing Memory Allocation Indicates a Memory Leak
The Heap Analyzer labels the segment type associated with your segments as SCA:MEM_GET_VM. This is a fairly low-level memory management routine that many segments might share. Your next step is to redefine the segment type to a more meaningful level of abstraction, perhaps one corresponding to the name of an application routine.
To redefine the segment type:
Figure 11-13 Do Not Use Type Menu Item Redefines Segment Type

After you determine the level of abstraction at which you want to view your segment, the next step is to examine the state of the call stack when the segment was allocated. Reviewing the traceback associated with a segment can reveal when and why it was created, and why a memory problem is occurring.
To request traceback information:
The traceback for your segment indicates that the crl_begin_unit_query routine sets up the environment for the SHOW UNITS command. To examine this event further, you can request to see the source code associated with it.
To request source code, double click MB1 on the traceback line that refers to crl_begin_unit_query.
Source code appears in the Source window. The routine call that placed crl_begin_unit_query on the call stack is highlighted (see Figure 11-14).
Figure 11-14 Click on Traceback Entry Shows Associated Source Code

11.5.5 Locating an Allocation Error in Source Code
After you connect a traceback entry to a routine in your application
source code, you can enlarge the Source window and search for
allocation errors in that source code location.
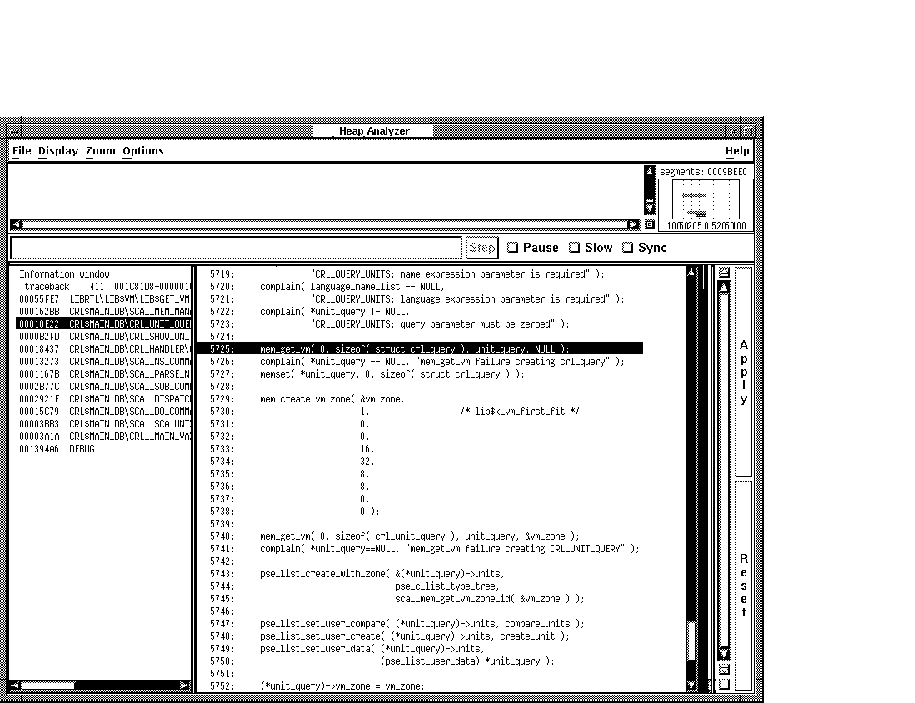
For example, the highlighted line 5725 in Figure 11-15 makes an allocation to unit_query. This allocation is not deallocated before line 5740, where an additional allocation occurs. This coding error is the cause of your memory leak.
Figure 11-15 Review of Source Code Shows Double Allocation

This chapter describes the following debugger convenience features not described elsewhere in this manual:
A debugger command procedure is a sequence of commands contained in a file. You can direct the debugger to execute a command procedure to re-create a debugging session, to continue a previous session, or to avoid typing the same debugger commands many times during a debugging session. You can pass parameters to command procedures.
As with DCL command procedures, you execute a debugger command procedure by preceding its file specification with an at sign (@). The @ is the execute procedure command.
Debugger command procedures are especially useful when you regularly
perform a number of standard setup debugger commands, as specified in a
debugger initialization file (see Section 12.2). You can also use a
debugger log file as a command procedure (see Section 12.3).
12.1.1 Basic Conventions
The following is a sample debugger command procedure named BREAK7.COM:
! ***** Debugger Command Procedure BREAK7.COM *****
SET BREAK/AFTER:3 %LINE 120 DO (EXAMINE K,N,J,X(K); GO)
SET BREAK/AFTER:3 %LINE 160 DO (EXAMINE K,N,J,X(K),S; GO)
SET BREAK %LINE 90
When you execute this command procedure with the execute procedure (@) command, the commands listed in the procedure are executed in the order they appear.
The rules for entering commands in command procedures are listed in the debugger's online help (type HELP Command_Format).
You can pass parameters to a command procedure. See Section 12.1.2 for conventions on passing parameters.
You can enter the execute procedure (@) command like any other debugger command: directly from the terminal, from within another command procedure, from within a DO clause in a command such as SET BREAK, or from within a DO clause in a screen display definition.
If you do not supply a full file specification with the execute procedure (@) command, the debugger assumes SYS$DISK:[]DEBUG.COM as the default file specification for command procedures. For example, enter the following command line to execute command procedure BREAK7.COM, located in your current default directory:
DBG> @BREAK7
The SET ATSIGN command enables you to change any or all fields of the default file specification, SYS$DISK:[]DEBUG.COM. The SHOW ATSIGN command identifies the default file specification for command procedures.
By default, commands read from a command procedure are not echoed. If you enter the SET OUTPUT VERIFY command, all commands read from a command procedure are echoed on the current output device, as specified by DBG$OUTPUT (the default output device is SYS$OUTPUT). Use the SHOW OUTPUT command to determine whether commands read from a command procedure are echoed or not.
If the execution of a command in a command procedure results in a
diagnostic of severity warning or greater, the command is aborted but
execution of the command procedure continues at the next command line.
12.1.2 Passing Parameters to Command Procedures
As with DCL command procedures, you can pass parameters to debugger command procedures. However, the technique is different in several respects.
Subject to the conventions described here, you can pass as many parameters as you want to a debugger command procedure. The parameters can be address expressions, commands, or value expressions in the current language. You must surround command strings in quotation marks ("), and you must separate parameters by commas (,).
A debugger command procedure to which you pass parameters must contain a DECLARE command line that binds each actual (passed) parameter to a formal parameter (a symbol) declared within the command procedure.
The DECLARE command is valid only within a command procedure. Its syntax is as follows:
DECLARE p-name:p-kind[, p-name:p-kind[, ...]]
Each p-name:p-kind pair associates a formal parameter (p-name) with a parameter kind (p-kind). The valid p-kind keywords are as follows:
| ADDRESS | Causes the actual parameter to be interpreted as an address expression. |
| COMMAND | Causes the actual parameter to be interpreted as a command. |
| VALUE | Causes the actual parameter to be interpreted as a value expression in the current language. |
The following example shows what happens when a parameter is passed to a command procedure. The command DECLARE DBG:ADDRESS, within command procedure EXAM.COM, declares the formal parameter DBG. The actual parameter passed to EXAM.COM is interpreted as an address expression. The command EXAMINE DBG displays the value of that address expression. The command SET OUTPUT VERIFY causes the commands to echo when they are read by the debugger.
! ***** Debugger Command Procedure EXAM.COM *****
SET OUTPUT VERIFY
DECLARE DBG:ADDRESS
EXAMINE DBG
The next command line executes EXAM.COM by passing the actual parameter ARR24. Within EXAM.COM, ARR24 is interpreted as an address expression (an array variable, in this case).
DBG> @EXAM ARR24
%DEBUG-I-VERIFYIC, entering command procedure EXAM
 DECLARE DBG:ADDRESS
 EXAMINE DBG
PROG_8\ARR24
    (1):        Mark A. Hopper
    (2):        Rudy B. Hopper
    (3):        Tim B. Hopper
    (4):        Don C. Hopper
    (5):        Mary D. Hopper
    (6):        Jeff D. Hopper
    (7):        Nancy G. Hopper
    (8):        Barbara H. Hopper
    (9):        Lon H. Hopper
   (10):        Dave H. Hopper
   (11):        Andy J. Hopper
   (12):        Will K. Hopper
   (13):        Art L. Hopper
   (14):        Jack M. Hopper
   (15):        Karen M. Hopper
   (16):        Tracy M. Hopper
   (17):        Wanfang M. Hopper
   (18):        Jeff N. Hopper
   (19):        Nancy O. Hopper
   (20):        Mike R. Hopper
   (21):        Rick T. Hopper
   (22):        Dave W. Hopper
   (23):        Jim W. Hopper
   (24):        Robert Z. Hopper
%DEBUG-I-VERIFYIC, exiting command procedure EXAM
DBG>
Each p-name:p-kind pair specified by a DECLARE command binds one parameter. For example, if you want to pass five parameters to a command procedure, you need five corresponding p-name:p-kind pairs. The pairs are always processed in the order in which you specify them.
For example, the next command procedure, EXAM_GO.COM, accepts two parameters: an address expression (L) and a command string (M). The address expression is then examined and the command is executed:
! ***** Debugger Command Procedure EXAM_GO.COM *****
DECLARE L:ADDRESS, M:COMMAND
EXAMINE L; M
The following example shows how you can execute EXAM_GO.COM by passing a variable X to be examined and a command @DUMP.COM to be executed:
DBG> @EXAM_GO X, "@DUMP"
The %PARCNT built-in symbol, which can be used only within a command procedure, enables you to pass a variable number of parameters to a command procedure. The value of %PARCNT is the number of actual parameters passed to the command procedure.
The %PARCNT built-in symbol is shown in the following example. The command procedure, VAR.DBG, contains the following lines:
! ***** Debugger Command Procedure VAR.DBG *****
SET OUTPUT VERIFY
! Display the number of parameters passed:
EVALUATE %PARCNT
! Loop as needed to bind all passed parameters and obtain their values:
FOR I = 1 TO %PARCNT DO (DECLARE X:VALUE; EVALUATE X)
The following command line executes VAR.DBG, passing the parameters 12, 37, and 45:
DBG> @VAR.DBG 12,37,45
%DEBUG-I-VERIFYIC, entering command procedure VAR.DBG
! Display the number of parameters passed:
EVALUATE %PARCNT
3
! Loop as needed to bind all passed parameters
! and get their values:
FOR I = 1 TO %PARCNT DO (DECLARE X:VALUE; EVALUATE X)
12
37
45
%DEBUG-I-VERIFYIC, exiting command procedure VAR.DBG
DBG>
When VAR.DBG is executed, %PARCNT has the value 3. Therefore, the FOR
loop within VAR.DBG is repeated 3 times. The FOR loop causes the
DECLARE command to bind each of the three actual parameters (starting
with 12) to a new declaration of X. Each actual parameter is
interpreted as a value expression in the current language, and the
EVALUATE X command displays that value.
12.2 Using a Debugger Initialization File
A debugger initialization file is a command procedure, assigned the logical name DBG$INIT, that the debugger automatically executes at debugger startup. Every time you start the debugger, the commands contained in the file are automatically executed.
An initialization file contains any command lines you might always enter at the start of a debugging session to either tailor your debugging environment or control the execution of your program in a predetermined way from run to run.
For example, you might have a file DEBUG_START4.COM containing the following commands:
! ***** Debugger Initialization File DEBUG_START4.COM *****
! Log debugging session into default log file (SYS$DISK:[]DEBUG.LOG)
SET OUTPUT LOG
!
! Echo commands as they are read from command procedures:
SET OUTPUT VERIFY
!
! If source files are not in current default directory, use [SMITH.SHARE]
SET SOURCE [],[SMITH.SHARE]
!
! Invoke screen mode:
SET MODE SCREEN
!
! Define the symbol SB as the SET BREAK command:
DEFINE/COMMAND SB = "SET BREAK"
!
! Assign the SHOW MODULE * command to KP7:
DEFINE/KEY/TERMINATE KP7 "SHOW MODULE *"
To make this file a debugger initialization file, use the DCL command DEFINE. For example:
$ DEFINE DBG$INIT WORK:[JONES.DBGCOMFILES]DEBUG_START4.COM
A debugger log file maintains a history of a debugging session. During the debugging session, each command entered and the resulting debugger output are stored in the file. The following is an example of a debugger log file:
SHOW OUTPUT
!noverify, terminal, noscreen_log, logging to DSK2:[JONES.P7]DEBUG.LOG;1
SET STEP NOSOURCE
SET TRACE %LINE 30
SET BREAK %LINE 60
SHOW TRACE
!tracepoint at PROG4\%LINE 30
GO
!trace at PROG4\%LINE 30
!break at PROG4\%LINE 60
     .
     .
     .
The DBG> prompt is not recorded, and the debugger output is commented out with exclamation points so the file can be used as a debugger command procedure without modification. Thus, if a lengthy debugging session is interrupted, you can execute the log file as you would any other debugger command procedure. Executing the log file restores the debugging session to the point at which it was previously terminated.
To create a debugger log file, use the SET OUTPUT LOG command. By default, the debugger writes the log to SYS$DISK:[]DEBUG.LOG. To name a debugger log file, use the SET LOG command. You can override any field of the default file specification. For example, after you enter the following commands, the debugger logs the session to the file [JONES.WORK2]MONITOR.LOG:
DBG> SET LOG [JONES.WORK2]MONITOR
DBG> SET OUTPUT LOG
![[HR]](../../IMAGES/REDBAR.GIF)
  4538P019.HTM
  OSSG Documentation
  22-NOV-1996 13:01:59.53
Copyright © Digital Equipment Corporation 1996. All Rights Reserved.