![[Digital logo]](../../IMAGES/DIGITAL-LOGO.GIF)
![[HR]](../../IMAGES/REDBAR.GIF)
![[Digital logo]](../../IMAGES/DIGITAL-LOGO.GIF)
![[HR]](../../IMAGES/REDBAR.GIF)
To avoid conflict with standard DECwindows Motif word selection, do not
use a double-click combination, such as Ctrl<Btn1Down>(2).
10.10.4.3 Defining the Font for Displayed Text
To define another font for the text displayed in various debugger windows and views, edit the current definition of the following resources in the resource file. For example:
DebugDefault.Font: -*-COURIER-BOLD-R-*--*-120-*-*-*-*-ISO8859-1
To bind a different command to a key that is already associated with a command, edit the current definition of the following resources in the resource file. For example:
<literal>(<Key>)0xFFB0: EnterCmdOnCmdLine("step/line 3") \n\
To bind a command to a key that is not currently associated with a
command, refer to the Keysym Encoding chapter of the X and Motif
Quick Reference Guide for key designations.
10.11 Debugging Detached Processes
You cannot use the DECwindows Motif interface to the debugger to debug detached processes, such as print symbionts, which run without a command line interpreter (CLI).
To debug a detached process that runs without a CLI, use the character-cell (screen mode) interface to the debugger (see Section 1.11).
The Heap Analyzer, available on both OpenVMS Alpha and OpenVMS VAX systems, is a feature of the debugger that provides a graphical representation of memory use in real time. By studying this representation, you can identify areas in your application where memory usage and performance can be improved. For example, you might notice allocations that are made too often, memory blocks that are too large, evidence of fragmentation, or memory leaks.
After you locate an area of interest, you can request an enlarged, more detailed, or altered view. You can also request additional information on the size, contents, or address of the allocations shown.
After you narrow your interest to an individual allocation, you can request traceback information. The analyzer allows you to correlate the traceback entry for an allocation with source code in your application program. By scrolling through the source code display, you can then identify problematic code and decide how to correct it.
This chapter describes the following:
The following sections describe how to invoke the Heap Analyzer and run
your application.
11.1.1 Invoking the Heap Analyzer
You can invoke the Heap Analyzer during a debugging session in one of the following ways:
$ DEFINE/USER/NAME=CONFINE LIBRTL SYS$LIBRARY:LIBRTL_INSTRUMENTED
To use the heap analyzer with a protected image, enter the following command and then execute your program:
$ DEFINE/EXEC/NAME=CONFINE LIBRTL SYS$LIBRARY:LIBRTL_INSTRUMENTED
This is necessary if the image was installed with the following command:
$ INSTALL ADD imagename/PROTECTED
You can invoke the Heap Analyzer outside a debugging session by entering the DEFINE/USER (or DEFINE/SYSTEM) command detailed above, and then the DCL command RUN/NODEBUG.
Note
On OpenVMS Alpha systems, the Heap Analyzer does not work on programs linked with the /NODEBUG qualifier.On OpenVMS VAX systems, the Heap Analyzer does work on programs linked with the /NODEBUG qualifier, although the traceback information displayed is minimal.
After you successfully invoke the Heap Analyzer, the Heap Analyzer
startup screen appears.
11.1.2 Viewing Heap Analyzer Windows
The Heap Analyzer contains a main window, six subsidiary windows, and a control panel (see Figure 11-1.)
The Memory Map, the most important window, displays a representation of your application's dynamic memory use. At startup, the Memory Map shows the images that comprise your application. As your application executes, you can see the relative location and size of individual memory blocks, images, program regions, memory zones, and dynamic strings as they are allocated and deallocated in memory space.
The Message window displays information on your Heap Analyzer session. At startup, the Message window contains the message "Heap Analyzer initialization complete. Press Start button to begin program." As your application executes, informational and error messages appear in this window.
The Push Button Control Panel contains buttons that allow you to control the speed of the Memory Map display. At startup, you click on the Start button to begin executing your application. As your application executes, you can click on other buttons in the panel to pause, slow, or otherwise affect the continuous display.
The Information window displays information on Memory Map segments. As your application executes, you can pause execution at any time to request specific information.
The Source window displays the application source code associated with a segment in the Memory Map.
The Do-not-use Type List allows you to adjust the Memory Map display by redetermining a segment's type, or group name.
The Views-and-Types Display allows you to adjust the Memory Map display by selectively viewing certain segment types.
The Type Histogram displays summary and statistical information on segment types.
As you use the Heap Analyzer, you may need to increase or decrease the size of the window in which you are working. To do this, pull the window pane sashes between windows or resize the screen as a whole.
Figure 11-1 Heap Analyzer Windows
| 1. Memory Map | Shows the graphical representation of memory, that is, the part of P0-space that is in use. Each allocation appears as a colored strip, or segment. |
| 2. Message Window | Displays Heap Analyzer informational and error messages and one-line segment descriptions. |
| 3. Information Window | Shows additional information on segments and segment types that appear in the Memory Map. |
| 4. Source Window | Shows application source code. |
| 5. Do-not-use Type List | Lists routines not used as segment types, the name that characterizes segments. |
| 6. Views-and-Types Display | Lists all segment types known to the Heap Analyzer and allows you to alter the segment display. |
| 7. Push Button Control Panel | Provides Start/Step, Pause, Slow, and Sync buttons that allow you to control the speed of Memory Map display. |
| 8. Type Histogram | Shows statistics on segment size and use. |
11.1.3 Viewing Heap Analyzer Pull-Down Menus
The Heap Analyzer provides five pull-down menus that are grouped over
the Memory Map (see Figure 11-2). This figure is adjusted slightly so
that all menu items can be seen.
Figure 11-2 Heap Analyzer Pull-Down Menus

| 1. File Menu | Allows you to exit from the Heap Analyzer. |
| 2. Display Menu | Allows you to adjust the Memory Map display and to clear the Information window. |
| 3. Zoom Menu | Provides a closer or further view of the Memory Map. |
| 4. Options Menu | Allows you to indicate a search directory list or to adjust the Do-not-use Type List. |
| 5. Help Menu | Provides context-sensitive or task-oriented online help. |
11.1.4 Viewing Heap Analyzer Context-Sensitive Menus
Most operations in the Heap Analyzer, however, are accomplished through
context-sensitive pop-up menus. Most Heap Analyzer windows contain a
pop-up menu listing available tasks (see Figure 11-3). To access a
window's pop-up menu, position your mouse pointer in the window and
click MB3.
Figure 11-3 Heap Analyzer Context-Sensitive Pop-Up Menus

| 1. Memory Map Pop-Up | Provides additional information on segments displayed in the Memory Map, allows you to jump to a segment's type in the Views-and-Types Display, or adds a segment's type to the Do-not-Use Type List. |
| 2. Information Window Pop-Up | Allows you to jump from a line of traceback displayed in the Information window to the related source code in the Source window. |
| 3. Do-not-use Type List Pop-Up | Deletes a segment's type from the Do-not-Use Type List. |
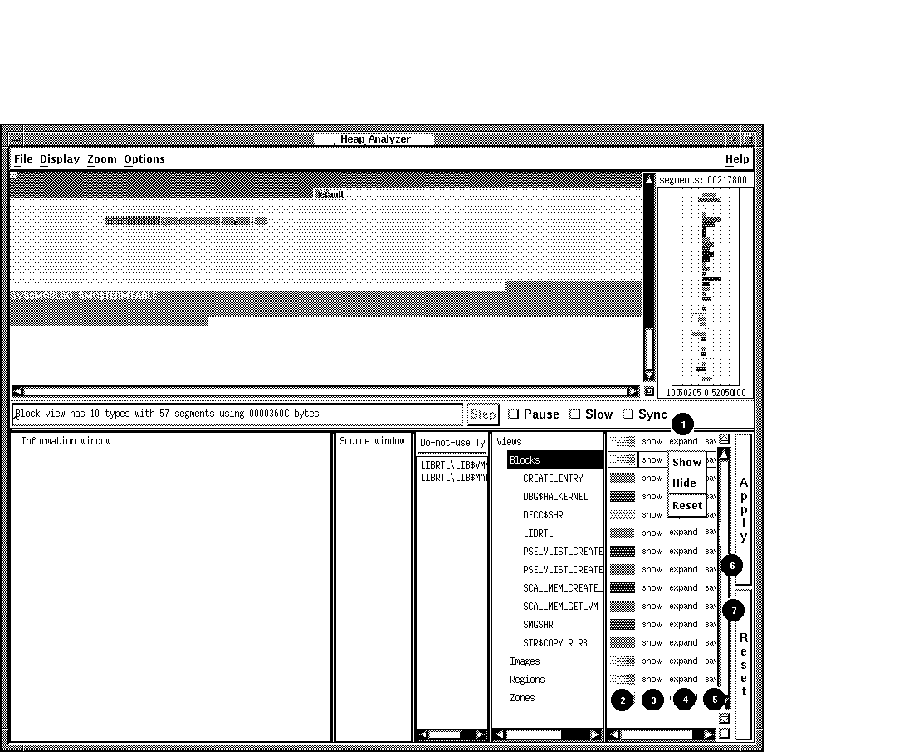
| 4. Views-and-Types Display Pop-Up |
Left side: Provides additional information on segment types listed,
highlights a segment type within the Views-and-Types Display, or adds a
segment type to the Do-not-Use Type List.
Right side: Allows you to adjust display characteristics for the segment type highlighted in the left side of the Views-and-Types Display. |
| 5. Type Histogram Pop-Up | Provides additional information on segment types listed, highlights a segment type in the Type Histogram, or adds the segment type to the Do-not-Use Type List. |
11.1.5 Setting a Source Directory
If you are invoking the Heap Analyzer from a directory other than the
one that stores your application source code, you can set a source
directory for the Heap Analyzer as soon as the startup screen appears.
To set a source directory:
The Heap Analyzer can now access your application.
11.1.6 Starting Your Application
If you invoked the Heap Analyzer from within a debugging session, start your application by performing the following steps:
If you invoked the Heap Analyzer outside a debugging session, start your application by performing only step 1 above.
After your application is running, the Memory Map (and other parts of the Heap Analyzer display) are continuously updated to reflect the state of your application.
Unless you intervene (see Section 11.1.7), this updating continues until
an occurrence causes memory events to stop. For example, your
application might prompt for input, the debugger might prompt for
input, or your application might finish execution.
11.1.7 Controlling the Speed of Display
To examine events in the Memory Map as your application is executing, you can use the Heap Analyzer's push buttons to slow, pause, and otherwise affect the speed of the display. Figure 11-4 shows these push buttons on the Heap Analyzer window just after the Start button was pushed.
The Slow and Pause push buttons allow you to slow or pause the display.
The Step push button allows you to single-step through memory events.
The Sync histogram (not shown) to the right of the Sync button indicates how far behind your application the Heap Analyzer is running. For performance reasons, the Heap Analyzer displays memory events a few seconds after their occurrence in your application.
Figure 11-4 Heap Analyzer Control Panel

| 1. Start Button | Click to start executing your application and enable the Memory Map display. Once you do so, the Start button changes to a Step button, which is initially dimmed (inaccessible). |
| 2. Step Button | Click to single-step through memory events in the Memory Map display. This button is dimmed until you click on the Pause button. |
| 3. Pause Button | Click to stop (or restart) execution of your application and the dynamic Memory Map display. |
| 4. Slow Button | Click to slow the dynamic Memory Map display. |
| 5. Sync Button | Click to force concurrent execution of your application program and display of memory events in the Memory Map. |
The Sync push button allows you to synchronize Heap Analyzer display and application execution, if this is important to you. Your application runs more slowly when you request synchronization.
On OpenVMS Alpha systems, anything that uses system service
interception, like the debugger or the Heap Analyzer, is unable to
intercept system service call images activated by shared linkage. The
image activator, therefore, avoids shared linkage for images linked or
run with /DEBUG, and instead activates private image copies. This
affects performance of applications under Heap Analyzer control, as
images activated by shared linkage run faster.
11.2 Working with the Default Display
The following sections describe how to use the Heap Analyzer when memory problems are clearly visible in the default Memory Map display.
Visible problems include allocations that are larger than you expect, that repeat numerous times, that increment at each allocation, and that could occur in a more efficient way.
In such cases, your Heap Analyzer session consists of the following steps:
Depending on the size of your application, you may wish to examine the Memory Map display as your application is running (by using the push buttons to slow, pause, or step through events) or after your application completes running (by using the Memory Map's vertical scroll bar to scroll back through the display).
You can identify segments whose size or location are not what you
expect by remembering that a segment's location in the Memory Map
corresponds to its location in dynamic memory. Lower addresses in
dynamic memory are represented in the upper left of the Memory Map
display. Addresses increase to the right and wrap at each line of the
display.
11.2.2 Options for Memory Map Display
As you examine the Memory Map, you may wish to select display options that allow you to see more clearly those parts of the display you are most interested in.
The Display Menu allows you to control whether you see segment type names within the Memory Map display, whether the display automatically scrolls to show the most recent activity, and whether you can compress the display.
The Zoom Menu allows you to control the degree of magnification with which you see segments in the Memory Map. Choosing the Far menu item, for example, shows an overview of memory. Choosing Extremely Close shows a more detailed view of memory.
Figure 11-5 shows the display options that appear in the Display pull-down menu. The figure then lists all the display options available in the Memory Map.
Figure 11-5 Heap Analyzer Display Menu

| 1. Display Menu |
Text Visible: (Default.) Labels each segment in the Memory Map with a
segment name, provided that the segment is large enough to carry a name
label.
Auto Scroll: (Default.) Automatically scrolls the Memory Map to the highest memory addresses (lower right) whenever the display is expanded. Reduce Scroll Region: When you request a limited or partial Memory Map display (see Section 11.3.3.2), compresses the display so that you can see as many segments as possible without scrolling to their location in the original display. Display All Segments: Displays segment definitions for all segments in the Memory Map. Clear Information Window: Clears text and messages from the Information window. |
| 2. Zoom Menu | Options provide a closer or more distant view of the Memory Map. |
11.2.3 Options for Further Information
As you examine the Memory Map display, you may find that you need more
information on those segments that interest you. The Memory Map pop-up
menu allows you to request segment, contents, address, and type
definitions for an individual segment.
A segment definition has the following form:
cursor-address n:init-address + length = end-address name ( view )
| cursor-address | The address beneath your cursor when you click MB3. |
| n | The number of your segment within the sequence of total segments. |
| init-address | The initial address of your segment. |
| length | The length (in bytes) of your segment. |
| end-address | The last address of your segment. |
| name | The segment type name of your segment. |
| view | The view of your segment: block, image, region, or zone. (See Section 11.3.3.2 for more information on views.) |
For example, the following segment definition describes the 15th segment in your Memory Map display, which is a segment of type LIBRTL:
0004ECA5 15: 00040000+0001CA00=0005CA00 LIBRTL (Image)
A contents definition consists of a partial segment definition (a segment definition without a cursor-address) and an ASCII representation of the contents of segment addresses. For example:
contents of: 38: 001C7000+000000C0=001C70C0
   LIBTRL\LIB$VM\LIB$GET_VM (Block)

          [ASCII representation]
An address definition takes the form of a statement describing user access to a stated address. For example:
001C710B is read and write accessible by the user
A type definition takes the form of a statement summarizing the total number of segments and total number of bytes devoted to a segment type. For example:
LIBRTL\LIB$VM\LIB$GET_VM (Block) has 39 segments
   using 00002160 bytes
Figure 11-6 shows the Memory Map context-sensitive pop-up menu. The figure then lists all the mouse and pop-up menu item choices available in the Memory Map.
Figure 11-6 Heap Analyzer Memory Map Context-Sensitive Pop-Up Menu

| 1. Memory Map | Click MB1: Displays the segment definition in the Message window. |
| 2. Map Pop-Up |
Traceback of Allocation: Displays the traceback information associated
with a segment in the Information window (see Section 11.2.4).
Display Segment: Displays the segment definition in the Information window. Display Contents: Displays the segment definition and contents of each address in the Information window. Display Address: Displays the position (address) under your cursor and the type of user access in the Information window. Display Type: Displays the segment type definition in the Information window. Go to Type: Allows you to jump from a segment type listed in the Type Histogram to the same segment type listed in the Views-and-Types Display. Do Not Use Type: Adds a segment type to the Do-not-use Type List. |
11.2.4 Requesting Traceback Information
After you identify an individual segment of interest, choose the
Traceback of Allocation menu item in the Memory Map pop-up menu.
Traceback information can help you understand why your segment was
created. Viewing traceback is also a preliminary step to displaying
application code.
Traceback information consists of a partial segment definition (a segment definition without a cursor address) and the list of elements on the call stack at the moment your segment was created. The element naming convention is image name\module name\routine name \line number. For example:
traceback:     8:000BA800+00065C00=00120400 DECC$SHR (Image)
00066EDE   DBG$HA_KERNEL
00005864   CRL$MAIN_DB\CRL_LIBRARY\crl__initialize_libraries\%LINE 5592
When the traceback display appears, you identify the traceback entry most closely associated with the segment you are investigating. Most often, you can do this by comparing segment type names and traceback routine names.
When you double click MB1 on this traceback entry, the source code associated with the entry appears (highlighted) in the Source window. You can then scroll through the source code display, identify problematic code, and decide how to correct it.
If you cannot identify any problems in the displayed source code, return to the Information window and double click MB1 on the routine immediately above or below your previous choice.
If you double click MB1 on a traceback entry, and 'Source Not Available' messages appear in the Source window, you may have forgotten to set a source directory at the beginning of your Heap Analyzer session. See Section 11.1.5 for information on setting a search directory.
Figure 11-7 shows the source code that appears when you double click MB1 on the traceback entry highlighted in the Information window. The figure then lists all the mouse and menu item choices available for the Source and Information windows.
Figure 11-7 Heap Analyzer Information and Source Windows

| 1. Information Window | Double click MB1: Allows you to jump from a line of traceback displayed in the Information window to the related source code in the Source window. |
| 2. Information Window Pop-Up | Go to Source: Allows you to jump from a line of traceback displayed in the Information window to the related source code in the Source window. |
| 3. Display Menu | Clear Information window: Clears text and messages from the Information window. |
11.3 Adjusting Type Determination and Display
The following sections describe the steps to perform when the memory
events represented in the default Memory Map are not clear; that is,
you cannot tell whether a problem exists or not.
This circumstance can occur when the segment type names chosen by the Heap Analyzer are too broad to be useful for your application, or when the Memory Map is so full that you cannot easily see the segment of interest.
In such cases, you can choose one or both of the following strategies:
If, by adjusting the type determination or display, you then identify
visible problems, you can resolve them in the same way you would if you
were working with the default Memory Map display. (For more
information, see Section 11.2.)
11.3.1 Options for Further Information
As you examine the Memory Map, you may wish to see a summary of Memory Map activity in the Type Histogram. The Type Histogram, which is two histograms back-to-back, shows the percentage of total segments and the percentage of total bytes devoted to each segment type in the Memory Map.
To see these graphical representations in numeric form, click MB1 on the segment type of interest.
To see the total number of segments or total number of bytes, check the top of each histogram.
Figure 11-8 shows the types listed in the Type Histogram. (This window has been resized so all types appear.) The figure then lists all the mouse and menu item choices available in the Type Histogram.
Figure 11-8 Heap Analyzer Type Histogram

| 1. Type Histogram | Click MB1: Displays the percentage of total segments and the percentage of total bytes represented by a segment. |
| 2. Type Histogram Pop-Up |
Display Type: Displays a type definition in the Information window.
Go To Type: Allows you to jump from a segment type listed in the Type Histogram to the same segment type listed in the Views-and-Types Display. Do Not Use Type: Adds a segment type to the Do-not-use Type List. |
![[HR]](../../IMAGES/REDBAR.GIF)
  4538P018.HTM
  OSSG Documentation
  22-NOV-1996 13:01:57.85
Copyright © Digital Equipment Corporation 1996. All Rights Reserved.