![[Digital logo]](../../IMAGES/DIGITAL-LOGO.GIF)
![[HR]](../../IMAGES/REDBAR.GIF)
![[Digital logo]](../../IMAGES/DIGITAL-LOGO.GIF)
![[HR]](../../IMAGES/REDBAR.GIF)
To rerun your program from the current debugging session, see Section 9.3.
To run another program from the current debugging session, see
Section 9.4.
9.7 Additional Options for Starting the Debugger
In addition to the startup procedure described in Section 9.1, the following options are available for starting the debugger from DCL level ($):
In all cases, before starting the debugger, verify that you have
compiled and linked the modules of your program (as explained in
Section 1.2) and established the proper debugging configuration (as
explained in Section 1.9).
9.7.1 Starting the Debugger by Running a Program
You can start the debugger and also bring your program under debugger control in one step by entering the DCL command RUN filespec (assuming the program was compiled and linked with the /DEBUG qualifier).
However, you cannot then use the Rerun or Run features explained in Section 9.3 and Section 9.4, respectively. To rerun the same program or run a new program under debugger control, you must first exit the debugger and start it again.
To start the debugger by running a program, enter the DCL command RUN filespec to start the debugger. For example:
$ RUN EIGHTQUEENS
By default, the debugger starts up as shown in Figure 9-4, executing any user-defined initialization file and displaying the program's source code in the main window. The current-location pointer shows that execution is paused at the start of the main program. The debugger sets the language-dependent parameters to the source language of the main program unit.
For more information about debugger startup, see Section 9.1.
9.7.2 Starting the Debugger After Interrupting a Running Program
You can bring a program that is executing freely under debugger
control. This is useful if you suspect that the program might be in an
infinite loop or if you see erroneous output.
To bring your program under debugger control:
For example:
$ RUN/NODEBUG EIGHTQUEENS
   .
   .
   .
[Ctrl/Y]
Interrupt
$ DEBUG
[starts debugger]
At startup, the debugger displays the main window and executes any user-defined initialization file, and sets the language-dependent parameters to the source language of the module in which execution was interrupted.
To help you determine where execution was interrupted:
When you start the debugger in this manner, you cannot then use the Rerun or Run features explained in Section 9.3 and Section 9.4, respectively. To rerun the same program or run a new program under debugger control, you must first exit the debugger and start it again.
For more information about debugger startup, see Section 9.1.
9.7.3 Overriding the Debugger's Default Interface
By default, if your workstation is running DECwindows Motif, the debugger starts up in the DECwindows Motif interface, which is displayed on the workstation specified by the DECwindows Motif applicationwide logical name DECW$DISPLAY.
This section explains how to override the debugger's default DECwindows Motif interface to achieve the following:
The logical name DBG$DECW$DISPLAY enables you to override the default interface of the debugger. In most cases, there is no need to define DBG$DECW$DISPLAY because the default is appropriate.
Section 9.7.3.4 provides more information about the logical names
DBG$DECW$DISPLAY and DECW$DISPLAY.
9.7.3.1 Displaying the Debugger's DECwindows Motif Interface on Another Workstation
If you are debugging a DECwindows Motif application that uses most of the screen (or if you are debugging pop-ups in a Motif application), you might find it useful to run the program on one workstation and display the debugger's DECwindows Motif interface on another. To do so:
DEFINE/JOB DBG$DECW$DISPLAY workstation_pathname
To display the debugger's command interface in a DECterm window, along with any program I/O:
$ DEFINE/JOB DBG$DECW$DISPLAY " "
For example:
$ DEFINE/JOB DBG$DECW$DISPLAY " "
$ DEBUG/KEEP
           Debugger Banner and Version Number
DBG>
You can now bring your program under debugger control as explained in Section 9.1.
9.7.3.3 Displaying the Command Interface and Program Input/Output in Separate DECterm Windows
This section describes how to display the debugger's command interface
in a DECterm window other than the DECterm window in which you start
the debugger. This separate window is useful when using the command
interface to debug a screen-oriented program as follows:
The effect is the same as entering the SET MODE SEPARATE command at the DBG> prompt on a workstation running VWS rather than DECwindows Motif. (The SET MODE SEPARATE command is not valid when used in a DECterm window.)
The following example shows how to display the debugger's command interface in a separate debugger window titled Debugger.
Example 9-1 Command Procedure SEPARATE_WINDOW.COM
$ ! Simulates effect of SET MODE SEPARATE from a DECterm window
$ !
$ CREATE/TERMINAL/NOPROCESS -
   /WINDOW_ATTRIBUTES=(TITLE="Debugger",-
           ICON_NAME="Debugger",ROWS=40)-
   /DEFINE_LOGICAL=(TABLE=LNM$JOB,DBG$INPUT,DBG$OUTPUT)
$ ALLOCATE DBG$OUTPUT
$ EXIT
$ !
$ ! The command CREATE/TERMINAL/NOPROCESS creates a DECterm
$ ! window without a process.
$ !
$ ! The /WINDOW_ATTRIBUTES qualifier specifies the window's
$ ! title (Debugger), icon name (Debugger), and the number
$ ! of rows in the window (40).
$ !
$ ! The /DEFINE_LOGICAL qualifier assigns the logical names
$ ! DBG$INPUT and DBG$OUTPUT to the window, so that it becomes
$ ! the debugger input and output device.
$ !
$ ! The command ALLOCATE DBG$OUTPUT causes the separate window
$ ! to remain open when you end the debugging session.
$ @SEPARATE_WINDOW
%DCL-I-ALLOC, _MYNODE$TWA8: allocated
$ DEASSIGN/JOB DBG$INPUT
$ DEASSIGN/JOB DBG$OUTPUT
By default, if your workstation is running DECwindows Motif, the debugger starts up in the DECwindows Motif interface, which is displayed on the workstation specified by the DECwindows Motif applicationwide logical name DECW$DISPLAY. DECW$DISPLAY is defined in the job table by FileView or DECterm and points to the display device for the workstation.
For information about DECW$DISPLAY, see the description of the DCL commands SET DISPLAY and SHOW DISPLAY in the OpenVMS DCL Dictionary.
The logical name DBG$DECW$DISPLAY is the debugger-specific equivalent of DECW$DISPLAY. DBG$DECW$DISPLAY is similar to the debugger-specific logical names DBG$INPUT and DBG$OUTPUT. These logical names enable you to reassign SYS$INPUT and SYS$OUTPUT, respectively, to specify the device on which debugger input and output are to appear.
The default user interface of the debugger results when DBG$DECW$DISPLAY is undefined or has the same translation as DECW$DISPLAY. By default, DBG$DECW$DISPLAY is undefined.
The algorithm that the debugger follows when using the logical definitions of DECW$DISPLAY and DBG$DECW$DISPLAY is as follows:
To enable the OpenVMS Debugger to start up in the DECwindows Motif interface, first enter one of the following DCL commands:
$DEFINE DBG$DECW$DISPLAY "WSNAME::0"

$SET DISPLAY/CREATE/NODE=WSNAME
where WSNAME is the nodename of your workstation.
9.7.3.5 Displaying a Debugging Session from a Personal Computer (PC)
Although displaying a debugging session from a PC is not officially
supported or tested at this time, many users have reported successful
results when using the following configurations:
Several combinations of VAXstations, AlphaStations, 486, and Pentium processors have been tried, with no serious restrictions or performance problems.
Following are some general tips:
This chapter explains how to:
The chapter describes window actions and window menu choices, but you can perform most common debugger operations by choosing items from context-sensitive pop-up menus. To access these menus, click MB3 while the mouse pointer is in the window area.
You can also enter commands at the DECwindows Motif command prompt. For information about entering debugger commands, see Section 8.3.
For the source code of programs EIGHTQUEENS.EXE and 8QUEENS.EXE, shown
in the figures of this chapter, see Appendix D.
10.1 Displaying the Source Code of Your Program
The debugger displays the source code of your program in the main window (see Figure 10-1).
Figure 10-1 Source Display

Whenever execution is suspended (for example, at a breakpoint), the debugger updates the source display by displaying the code surrounding the point at which execution is paused. The current-location pointer, to the left of the source code, marks which line of code will execute next. (A source line corresponds to one or more programming-language statements, depending on the language and coding style.)
By default, the debugger displays compiler-generated line numbers to the left of the source code. These numbers help identify breakpoints, which are listed in the breakpoint view (see Section 10.4.4). You can choose not to display line numbers so that more of the source code can show in the window. To hide or display line numbers, toggle Display Line Numbers from the File menu on the main window.
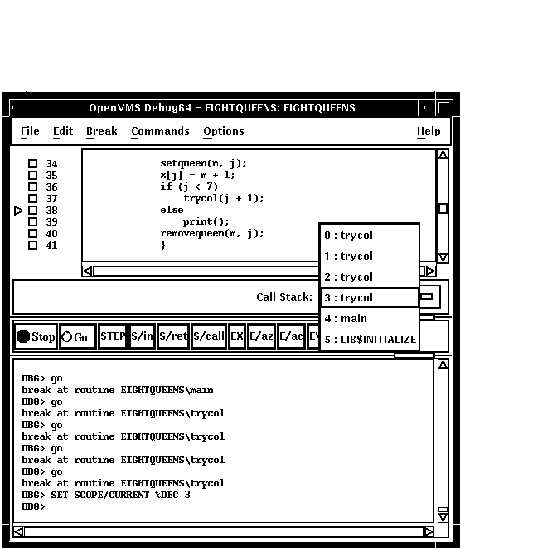
The Call Stack menu, between the source view and the push button view, shows the name of the routine whose source code is displayed.
The current-location pointer is normally filled in as shown in Figure 10-1. It is cleared if the displayed code is not that of the routine in which execution is paused (see Section 10.1.3 and Section 10.6.2).
You can use the scroll bars to show more of the source code. However, you can scroll vertically through only one module of your program at a time. (A module corresponds generally to a compilation unit. With many programming languages, a module corresponds to the contents of a source file. With some languages, such as Ada, a source file might contain one or more modules.)
The following sections explain how to display source code for other parts of your program so that you can set breakpoints in various modules, and so on. Section 10.1.3 explains what to do if the debugger cannot find source code for display. Section 10.6.2 explains how to display the source code associated with routines that are currently active on the call stack.
After navigating the main window, you can redisplay the location at which execution is paused by clicking on the Call Stack menu.
If your program was optimized during compilation, the source code
displayed might not reflect the actual contents of some program
locations
(see Section 1.2).
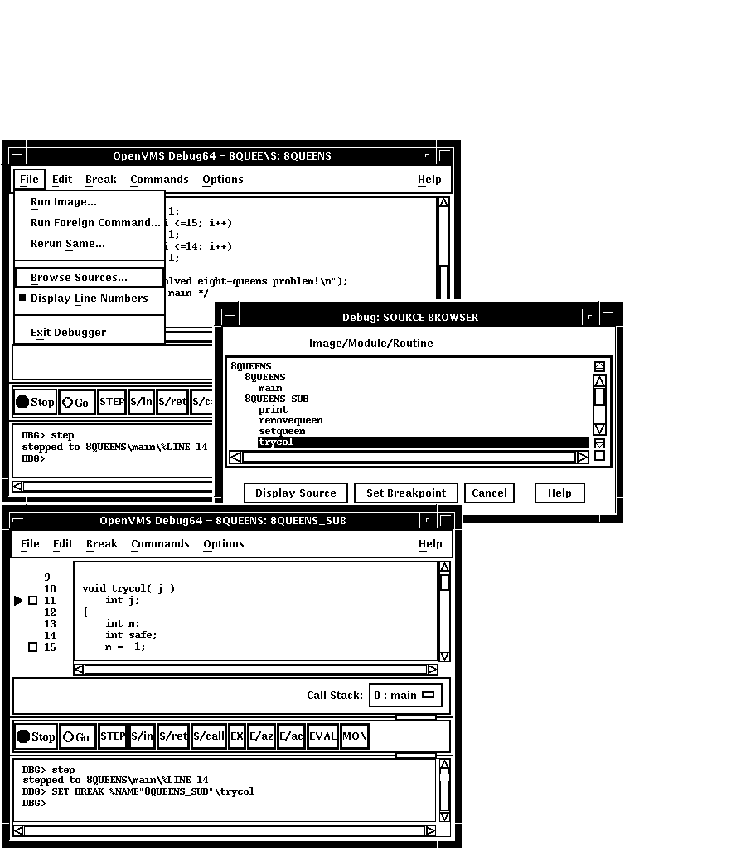
10.1.1 Displaying Source Code of Another Routine
To display source code of another routine:
Section 10.6.2 describes an alternative way to display routine source code for routines currently active on the call stack.
Figure 10-2 Displaying Source Code of Another Routine

10.1.2 Displaying Source Code of Another Module
To display source code of another module:
In certain cases, the debugger cannot display source code. Possible causes are:
If the debugger cannot find source code for display, it tries to
display the source code for the next routine down on the call stack for
which source code is available. If the debugger can display source code
for such a routine, the current-location pointer is cleared and marks
the source line to which execution returns in the calling routine.
10.1.4 Specifying the Location of Source Files
Information about the characteristics and the location of source files
is embedded in the debug symbol table of your program. If a source file
has been moved to a different directory since compile time, the
debugger might not find the file. To direct the debugger to your source
files, use the SET SOURCE command at the DBG> prompt (see
Section 6.2).
10.2 Editing Your Program
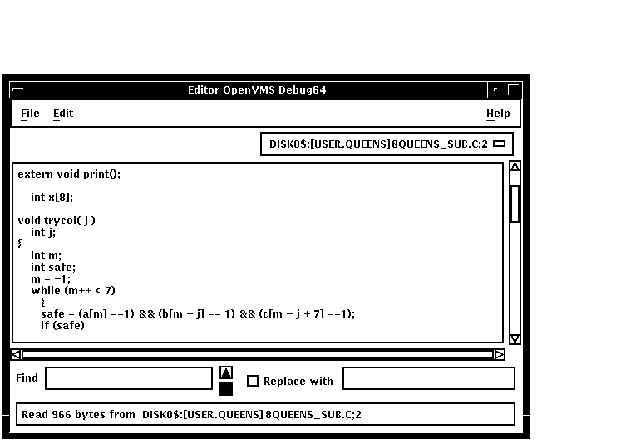
The debugger provides a simple text editor you can use to edit your source files while debugging your program (see Figure 10-3).
The text editor available through the debugger's DECwindows Motif menu interface is a simple convenience feature, not intended to replace sophisticated text editors such as the Language-Sensitive Editor (LSE). You cannot substitute a more sophisticated editor for the text editor invoked with the Edit File item in the Commands menu. To use a different editor, enter the EDIT command at the DBG> prompt in the command view (see the description of the EDIT command in Part III of this manual).
Note
When you enter an EDIT command at the command prompt, the debugger utilizes the DECterm window that invoked the debugging session as the user-defined-editor window (as opposed to the debugger's built-in editor, which is hardwired to the COMMANDS EDIT FILE pull-down menu). This behavior constitutes a tradeoff that allows a more flexible choice of editors. If you inadvertently exit this DECterm window using FILE EXIT or MWM Close, the debugging session terminates abruptly, having lost its parent window.
Figure 10-3 Editor Window

To invoke the editor, choose the Edit File item in the Commands menu on the main window. By default, the editor opens a buffer and displays the module currently displayed in the source view. The buffer is named with the file specification of the file in the buffer. If no file is displayed in the source view, the editor displays an empty text buffer, called main_buffer. The buffer name appears in the buffer menu, which is just under the menu bar of the editor view.
The editor allows you to create any number of text buffers by choosing New (for empty text buffers) or Open (for existing files) from the File menu. The name of each text buffer appears in the buffer menu. You can cut, copy, and paste text from buffer to buffer by choosing items from the Edit menu and selecting buffers from the buffer menu.
You can perform forward and backward search and replace operations by entering strings in the Find and Replace with fields and clicking on a directional arrow. You can perform a repeated search for the string by continuing to press the Return key. You can also continue a search by choosing the Find/Replace Next or Find/Replace Previous items in the Edit menu.
To save the file, choose the Save or Save As... items from the File menu. If you do not save your corrections before closing a modified buffer or exiting the debugger, the debugger displays a warning message.
To test any changes to the source code:
This section explains how to:
For information about rerunning your program or running another program
from the current debugging session, see Section 9.3 and Section 9.4.
10.3.1 Determining Where Execution Is Currently Paused
To determine where execution is currently paused within your program:
To list the sequence of routine calls that are currently active on the
call stack, click on the Call Stack menu. Level 0 denotes the routine
in which execution is paused, level 1 denotes the calling routine, and
so on.
10.3.2 Starting or Resuming Program Execution
To start program execution or resume execution from the current location, click on the Go button in the push button view (see Figure 8-3).
Letting your program run freely without debugger intervention is useful in situations such as the following:
![[HR]](../../IMAGES/REDBAR.GIF)
  4538P015.HTM
  OSSG Documentation
  22-NOV-1996 13:01:52.91
Copyright © Digital Equipment Corporation 1996. All Rights Reserved.